
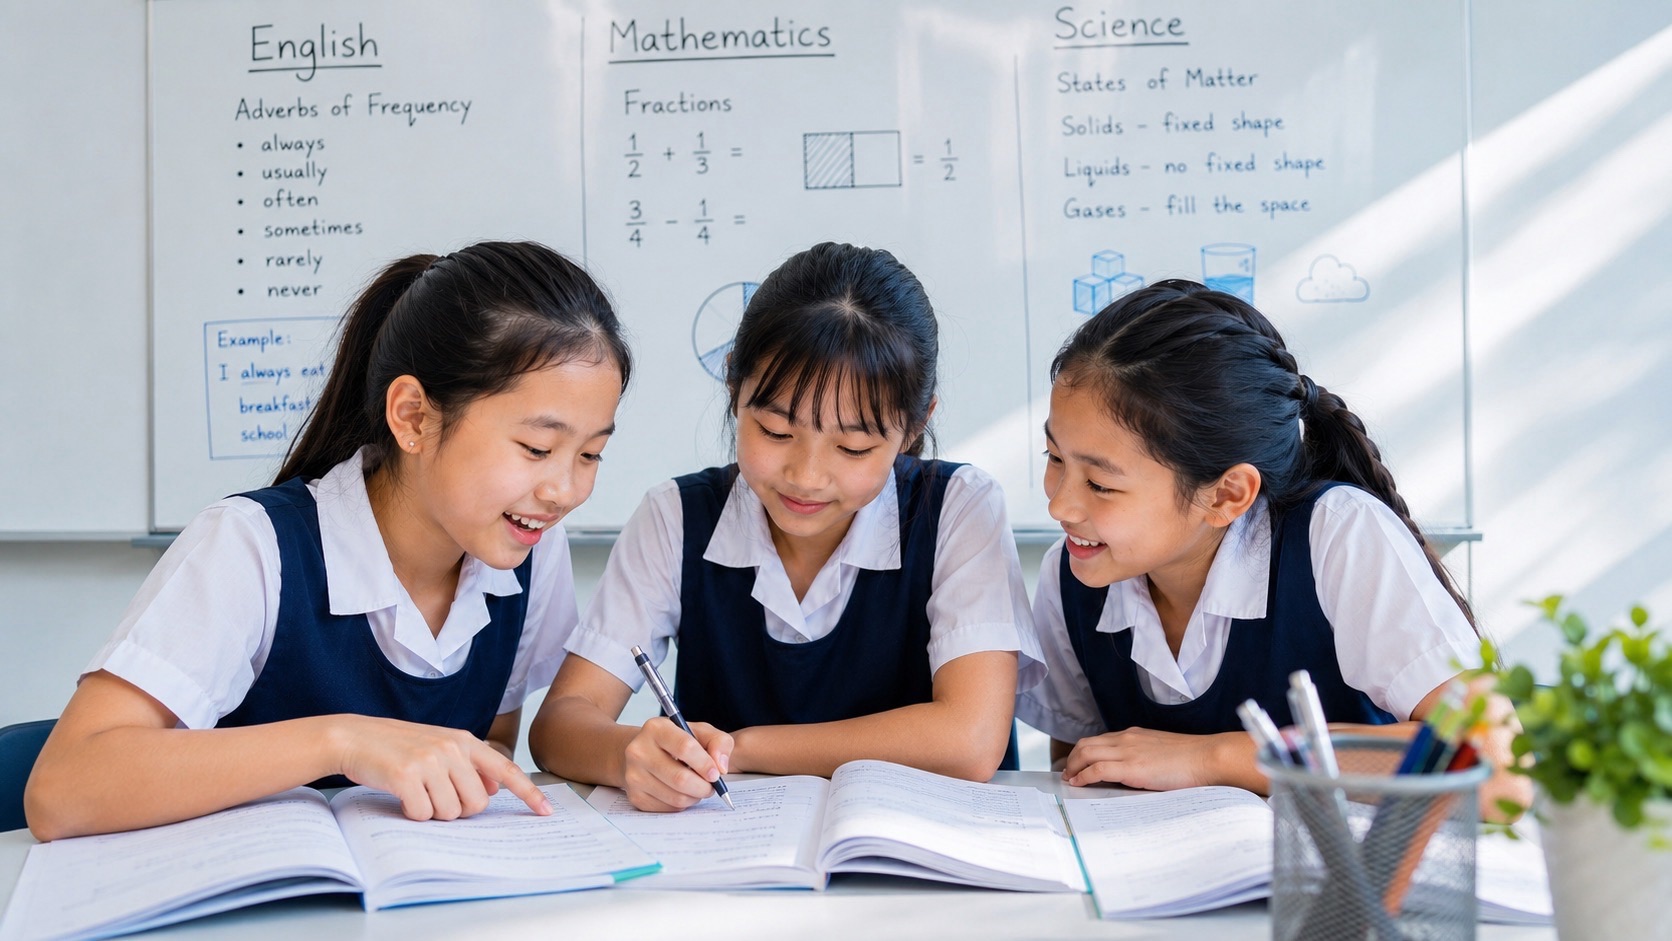
Hougang Science Tuition is a legacy 2017 title rebuilt for a current learning purpose. Families searching for Primary Science tuition in Hougang, PSLE Science tuition, small-group Science classes, MOE Science support, experiments, variables, fair tests, graphs, data interpretation and PSLE preparation often need help with one specific part of Science: turning observations into trustworthy evidence.
Primary Science becomes much more manageable when students understand how investigations work. They need to identify what changed, what was measured, what had to stay constant, how results were recorded, what pattern the data shows and what conclusion the evidence can actually support. These habits sit at the heart of scientific inquiry and appear repeatedly in school and PSLE questions.
This rebuilt page therefore focuses on experiments, variables, fair tests, evidence and scientific judgement. It does not claim a current Hougang or Marina Bay centre, and the old phone number, tutor promotions, obsolete stream labels and unrelated travel galleries have been removed. The historical title and URL remain while the body now teaches a durable Science operating system.
Science is not only what we know; it is how we know
A student can memorise that plants need light and still struggle with an experiment comparing plants under different conditions. The question may not ask for the fact directly. It may ask whether the investigation was fair, what variable was changed, why one condition must remain constant, or whether the data justifies the conclusion.
That is the difference between scientific knowledge and scientific practice.
Good Science tuition should build both.
The four-part experiment map
- Changed variable: what the investigator deliberately changes.
- Measured variable: what is observed or measured as the result.
- Controlled conditions: relevant factors kept the same so the comparison remains meaningful.
- Conclusion: the relationship supported by the evidence.
Students should be able to describe all four before attempting a long explanation.
Why fair tests matter
A fair test is not a ritual in which students write “keep everything the same”. It is a way to isolate a relationship.
If a pupil wants to find out whether light intensity affects plant growth, changing both light and water makes the result ambiguous. Even if one plant grows more, we cannot tell which changed condition caused the difference.
The scientific habit is simple: change the factor you want to test, measure the response, and keep other relevant factors comparable.
Not every variable needs to be controlled
Students sometimes overlearn the phrase “keep everything the same” and list irrelevant details. Good reasoning asks which conditions could realistically influence the measured result.
That distinction matters because Science is about controlling meaningful alternatives, not freezing the universe.
Independent variable and dependent variable without jargon overload
For Primary students, “what was changed?” and “what was measured?” are often sufficient starting points. Terminology can be added where the school uses it, but meaning should come first.
If students can identify the roles in plain language, the scientific structure is present.
Observation versus inference
An observation reports what can be directly seen, measured or recorded. An inference explains or interprets that observation using scientific knowledge.
“The thermometer reading increased from 25°C to 40°C” is an observation.
“The water absorbed thermal energy” is an interpretation based on the scientific model.
Students lose marks when they supply an explanation where an observation is requested—or merely repeat an observation where an explanation is required.
Read the command word before writing
- State: give the required fact or result directly.
- Describe: report the pattern, change or feature.
- Explain: connect evidence to a scientific relationship or mechanism.
- Compare: identify a meaningful difference or similarity between two conditions.
- Predict: use a pattern or scientific model to state what is likely to happen.
The child should know which job the question is asking for before choosing the answer form.
Tables are evidence structures
A table should be read deliberately.
- What does each row represent?
- What does each column represent?
- Are units included?
- Which condition is the comparison?
- Is there a clear pattern?
- Are there unusual results?
Students who jump straight to the largest number can miss the scientific relationship.
Graphs turn data into patterns
A graph is useful because it makes change visible. Students should read axis labels, units and scales before interpreting the line or bars.
A strong response moves through three layers:
- Pattern: what the data does.
- Relationship: how one variable changes with another.
- Mechanism: the scientific idea that can explain the relationship.
This prevents a graph question from becoming a simple number-reading exercise.
Correlation is not automatically cause
At Primary level, students do not need a university statistics lecture. They do need one disciplined habit: a pattern alone does not prove every possible causal story.
If two conditions differ in several relevant ways, the evidence may not isolate the cause. This is why fair tests matter.
Repeating measurements improves confidence
One measurement can be affected by random variation or recording error. Repeated measurements can reveal whether a pattern is stable.
Students should understand the purpose rather than memorise “repeat three times” as a magic phrase. Repetition is useful when it improves reliability and helps detect unusual results.
Why averages can help
When repeated measurements vary slightly, an average may provide a useful summary. But averaging cannot rescue a badly designed experiment.
Good evidence requires both sensible measurement and sensible design.
Designing an investigation
A strong investigation plan answers:
- What question are we trying to answer?
- What will we change?
- What will we measure?
- What relevant conditions should remain the same?
- How will measurements be recorded?
- How many observations are needed?
- What pattern would support the hypothesis?
This structure trains planning rather than memorised experiment vocabulary.
Primary 3–4: build the language of evidence
Younger students should become comfortable with observing, comparing, classifying and describing patterns. They can learn to separate “what happened” from “why it happened”.
This creates a foundation for later experiment questions.
Primary 5: experiments become application questions
Students may meet unfamiliar apparatus or organisms. The goal is not to recognise the picture from a workbook. It is to identify the variables and relationship.
Ask: what is the experiment actually trying to find out?
That question often makes the rest of the setup easier to read.
Primary 6: evidence must survive examination pressure
For the 2026 PSLE Science examination, SEAB lists one 1 hour 45 minute written paper with two booklets. Booklet A contains 30 multiple-choice questions worth 60 marks. Booklet B contains 10–11 structured questions worth 40 marks.
Experiment, graph and data questions can appear in ways that require students to read quickly without becoming careless. The best preparation is not to memorise every apparatus picture. It is to have a repeatable way to extract the scientific structure.
The six-step experiment routine
- Read the question before studying every detail.
- Identify what was changed.
- Identify what was measured.
- Mark important controlled conditions.
- Read the data pattern.
- Write only the conclusion the evidence supports.
This routine should become fast because it has been practised slowly first.
Common experiment errors
- confusing the changed and measured variables;
- naming an irrelevant control;
- describing data instead of explaining it;
- claiming cause when several factors changed;
- ignoring units;
- reading the graph scale incorrectly;
- making a conclusion broader than the tested conditions;
- copying values without stating the relationship.
Each error should produce a future rule.
Turn errors into rules
Examples:
- “Before writing a conclusion, name the changed and measured variables.”
- “Read both axes and units before reading the graph.”
- “If two relevant conditions changed, do not claim one caused the result.”
- “When asked to explain, add the scientific mechanism after the evidence.”
Then test the rule on a fresh problem.
Small-group Science makes reasoning visible
Three students can inspect the same experiment and disagree about which variable matters. That disagreement is useful if the tutor asks them to justify their choice from the setup.
One student may notice the changed factor, another the missing control, and another an unsupported conclusion. Peer comparison can deepen evidence judgement while every learner still writes an independent answer.
A 90-minute investigation-focused lesson
- 10 min: retrieval from earlier Science topics.
- 15 min: one experiment diagnostic.
- 15 min: teach or repair variable/control logic.
- 15 min: read a table or graph.
- 15 min: explain the scientific relationship.
- 15 min: fresh investigation with prompts removed.
- 5 min: record the error rule and retest date.
How to practise without memorising setups
Change the surface. Use plants today, cooling water tomorrow, magnets next week and evaporation later. Keep the same experimental reasoning.
If the student can still identify changed, measured and controlled variables, the learning is transferring.
What parents can ask
- What was the experiment trying to find out?
- What changed?
- What was measured?
- Which control mattered most and why?
- What conclusion did the data support?
- What conclusion would be too strong?
These questions turn homework into scientific conversation rather than answer checking.
What progress looks like
- the child identifies variables without prompting;
- controls are chosen for a reason;
- data is described accurately before explanation;
- conclusions stay within the evidence;
- graph scales and units are read more reliably;
- unfamiliar apparatus feels less intimidating;
- the student can critique a weak experimental design.
Frequently asked questions
Why does my child know Science but lose experiment marks?
The content may be present while investigation-reading skills are weak. Practise variable identification, fair-test logic, data patterns and evidence-based conclusions separately.
Should students memorise standard experiment answers?
They should remember important scientific relationships, but experiment reasoning should be reconstructed from the actual setup and evidence.
How can graph questions improve?
Train a fixed reading order: title or context, axes, units, scale, pattern, then explanation.
What does a good conclusion look like?
It states the relationship supported by the experiment without claiming more than the tested conditions justify.
The durable Hougang Science Tuition lesson
Science becomes more powerful when students can explain not only what they think is true, but why the evidence deserves confidence.
The operating sequence is simple: question → variable → control → measurement → pattern → conclusion → mechanism → retest.
That is how experiment questions stop looking like puzzles and start behaving like scientific reasoning.
Official and eduKate routes
- MOE — Primary Science Teaching & Learning Syllabus
- SEAB — 2026 PSLE Science syllabus and examination format
- Science Tuition & Learning Hub
- Student Diagnostics Hub
- The Library
Archive note: the old Marina Bay address, phone number, tutor promotions, obsolete stream labels and unrelated galleries have been removed. The title, URL, original publication date and featured image are preserved.
Properly taught kids shine a bright light into the future.